About the Tool
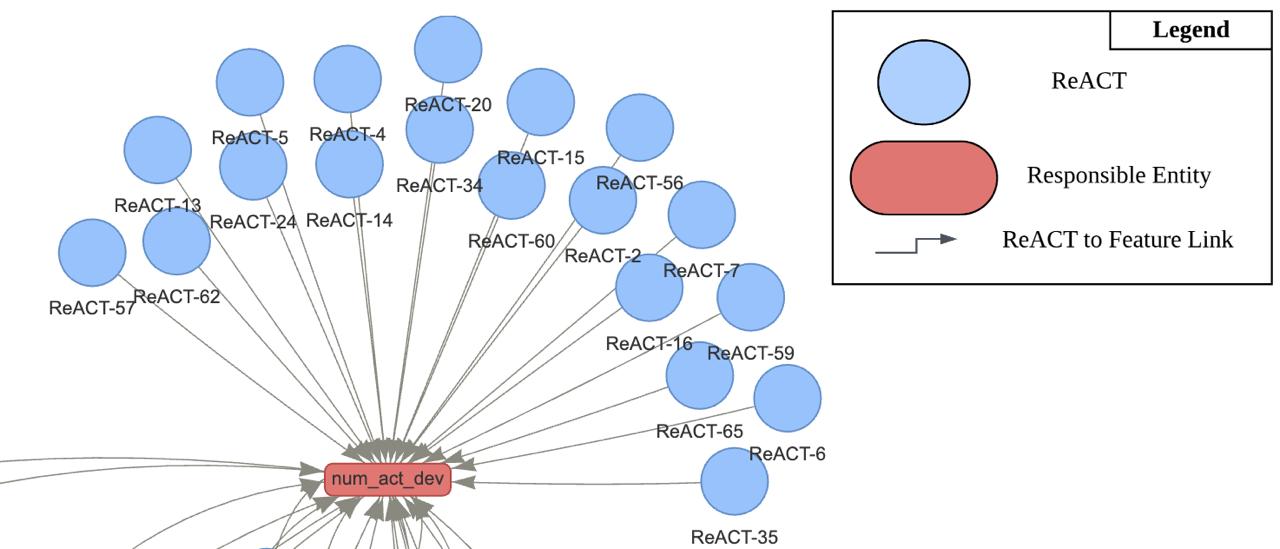
ReACTive is an interactive tool that visualizes the connection between ReACTs and the features, and the associativity of ReACTs with entities (personnel responsible for performing ReACTs). The tool is primarily designed for developers, with secondary utility extending to all individuals engaged in the OSS Community. ReACTive displays an interactive network graph to visualize ReACTs and their impact on each of the features. A snapshot of the graph is shown in Figure 1. This dynamic network graph adopts a directed acyclic graph (DAG) structure, featuring circular nodes (color: light blue) representing ReACTs, rectangular nodes (color: light red) delineating features, and edges symbolizing articles. Edges connect circular nodes (ReACTs) to rectangular nodes (features), indicating the existence of at least one article observing the effect. The edges are weighted, representing the strength of the relationship.
Development of the Tool
The tool's front-end is crafted with a blend of HTML, CSS, and JavaScript. Python's PyVis library has been used to generate the interactive network graphs, while python's Plotly Plotly has been harnessed to generate the other interactive plots (bar-chart, pie-chart, scattered plot). The plots offer interactivity by displaying tooltips when users hover over or click on any component of the graph. A tooltip is a small pop-up box that appears when a user hovers over an element on a web page. It provides additional information or a brief description related to the element. To preserve the interactivity of the plots, each plot was individually transformed into an HTML file. Subsequently, these files were embedded into the front-end using HTML's inline element known as the iframe. This element facilitates the creation of a nested browsing context, allowing the display of a distinct HTML document within the main document.
Use-Cases of the tool
Use Case 1: Finding ReACTS to Tune Features
ReACTive can be used to find the ReACTs, responsible for tuning a particular feature. Hovering over a node provides a detailed description of the node, as tooltips. Hovering over an edge reveals relevant information, including article count, references, and links. This feature enables users to directly access articles from the tool that observed the relationship between a ReACT and a feature. Additionally, clicking on a specific feature node in the graph highlights all associated ReACT nodes, offering insights into the ReACTs to consider when tuning a particular feature. This interactive functionality enhances user experience and facilitates a more in-depth exploration of the relationships within the data.
Use Case 2: Finding roles and responsibilities
ReACTive can be used to understand the roles of the personnel who are responsible for performing each of the ReACTs. An interactive scattered plot has been utilized to show the relationship between ReACTs and the entities. The graph displays entities along the X-axis, with ReACTs represented on the Y-axis. Interconnections between a ReACT and an entity are visually depicted as square boxes. Clicking on these boxes reveals tooltips, providing insights into the specific connection between a ReACT and an entity, which includes definitions for the components to offer a comprehensive understanding. Thus, with ReACTive, users can easily discern the ReACTs assigned to them, enhancing clarity and facilitating their responsibilities.
